Advancements in GIS (geographic information systems) have allowed scholars to marshal large amounts of evidence that support their hypotheses into the forces that shape history. But GIS achieves something else as well: with this technology, historians can create maps that guide them into unknown terrain and to surprising insights into the past.
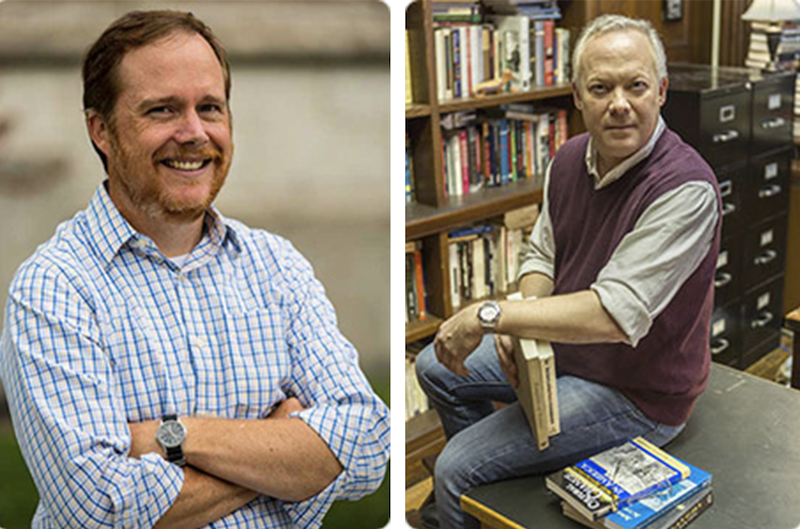
Bowdoin's Patrick Rael, a professor of history, and Aaron Gilbreath, a statistical consultant, are introducing students to this research technique in a new class they're offering this semester: Mapping American History Using Geographic Information Systems (GIS)
“For twenty years on campus, we've been playing around with GIS and the ways we can do history with big data,” said Rael, “and that was something I wanted to share with my students.”
But he needed a teaching partner. Gilbreath, a former geography professor at College of Staten Island, CUNY, came to Bowdoin in 2016 to join the College's IT department. While Rael brings his expertise in nineteenth-century US history—particularly in the areas of African Americans, slavery, and the Civil War—Gilbreath contributes his knowledge of GIS and its applications for research.
Though their class is anchored in the nineteenth century, its scope is fairly broad. Over the semester, the course—which is cross-listed in history and digital and computational studies—examines the expansion of slavery in the early republic, the domestic slave trade, and the ownership of slaves by African Americans. Students also study the urbanization of antebellum America, the downfall of the Whigs, and the transportation revolution.
The interdisciplinary class has attracted students from a range of academic backgrounds: it includes majors in history, government and legal studies, music, sociology, anthropology, German, math, and computer science.
While students will dig through different archives, including some they find on their own, the US census in particular provides a rich source of material. During the nineteenth century, the federal government expanded the census to include a growing range of variables to describe American life, including details like the number of churches in a county and the value of its farms, Rael said. “That leaves historians a huge wealth of information on aspects of American society that otherwise would be hard to get at,” he added.
Throughout the semester, students will be applying the GIS skills they are learning to the examination of historical problems and long-standing debates. After mapping a data set, or several data sets—which will include a mix of locations, dates, and quantitative information—they can begin to see how aspects of American life changed over time and across regions.
Gabriel Batista ’23, a student who described himself as a former “STEM kid” considering a double major or minor in history, enrolled in the class because he is interested in maps, cartography, and geography. Plus, his high school history teacher urged him not to miss a class with Rael.
Halfway through semester, Batista said he now thinks about maps differently, less “as explanations of historical patterns” and more as “part of the investigative process.”
Maps, he continued, “lead to further questions that enrich the discourse of historical debates. It makes sense to look for patterns that lead to more questions, but it's never something I would have thought of before this class.”
Gilbreath agrees: “The point is to use GIS to test a theory, to see if it supports it, or to explore questions that might not even have occurred to you until you plot the data.”
Possible Research Avenues
For a capstone project, students are being asked to use GIS to present a hypothesis about a historical problem backed up with “maps, maps, and more maps.”
Gilbreath and Rael both offered several possible historical inquiries that GIS can help illuminate. (In addition to learning the software program ArcGIS, students are being taught how to digitize old paper maps).
- Layer a map of Maine railroads with state counties to see whether the areas along the rail lines were wealthier, or consistently wealthier, over time and up to today.
- Explore the fate of political parties, like the Whig Party, which collapsed in the 1850s and was reborn as the Republican Party.
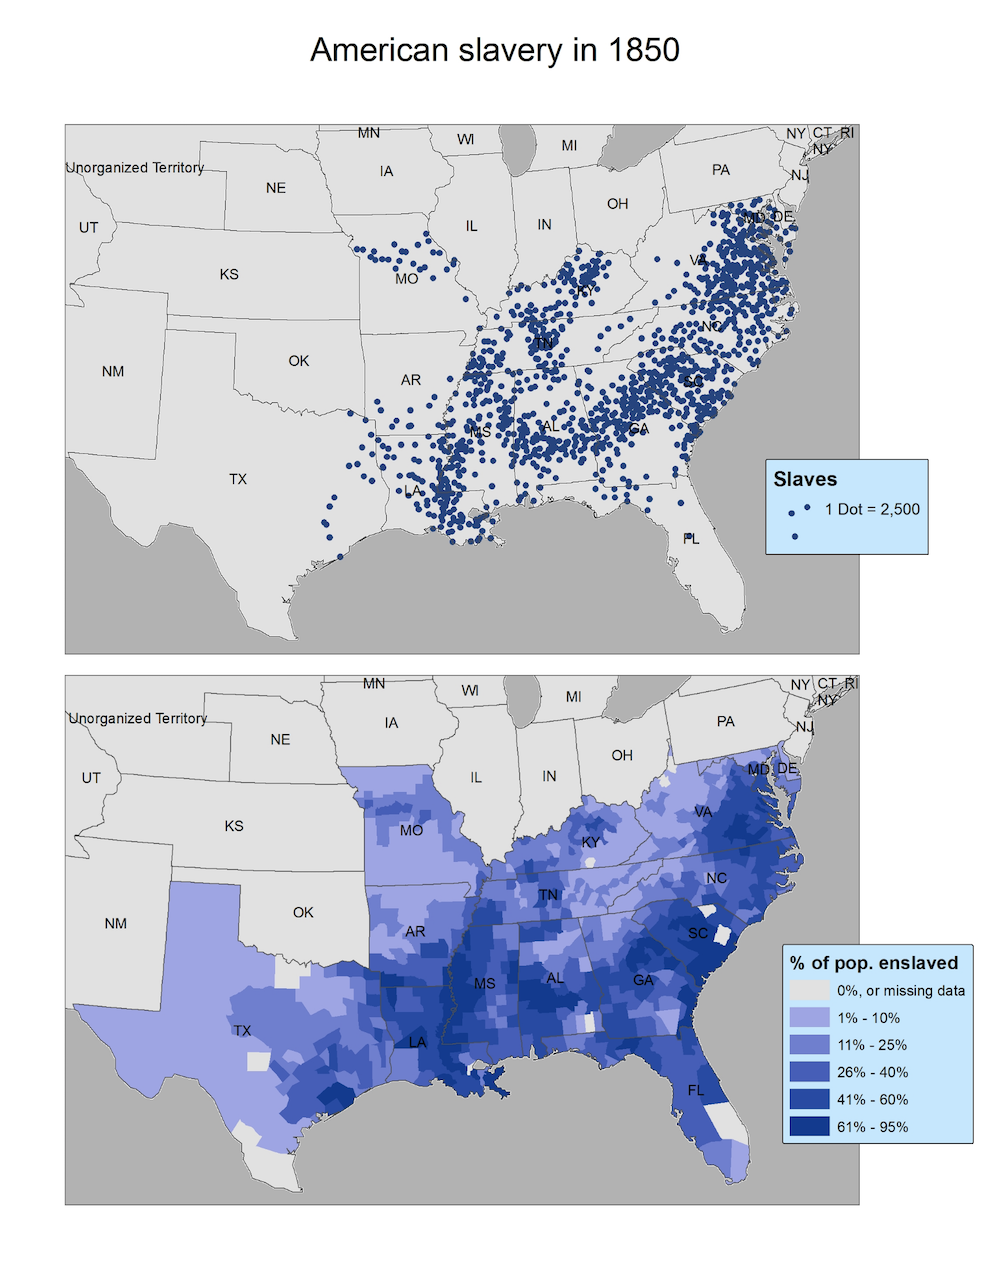
- Test the slave-breeding hypothesis, which is the claim that planters in some parts of the US inflated their slave populations so they could sell people on the domestic market.
- Plot the mean center of slavery for each US census to track how slavery steadily moved south and west.
- Layer a map of historical Native American lands with the average economic value of counties to see the value of the land that was stolen from Native tribes.
Possible GIS Pitfalls
Though GIS opens up many research possibilities, Gilbreath and Rael warn their students about its limitations as well.
“History is made up of people who are complicated,” Rael said. “The power of GIS is that it allows us to aggregate large numbers of people but, by turning people into numbers, there are two potential issues: you lose the texture of the past, the way people lived their lives.”
“And the other concern,” he continued, “is that when everything is turned into numbers—and we're using math to analyze those numbers—it can create a sense of authority that might not be wholly merited.”
Gilbreath referred to this problem as the “god's eye trick”—the idea that when you look at things from above, you might presume you understand and see more than you actually do.
Additionally, the professors encourage students to evaluate the source of their data. “The historical census, for example, chronically undercounted poor people, people of color, and foreign-born folks,” Rael said.
ArcGIS is a huge program to run, and it works better on PCs than Macs. To ensure students in the class had access to it, Bowdoin negotiated a contract with Amazon WorkSpaces. This app allows students—even those with old computers—to connect to the Bowdoin network and run a fast PC on their iPad or Mac and also run any software Bowdoin has licenses for.
Patrick Rael added he's also grateful to the College for supporting GIS in research and in teaching, and in particular he and Aaron Gilbreath wanted to acknowledge the help of Bowdoin Educational Research Consultant Jennifer Snow.