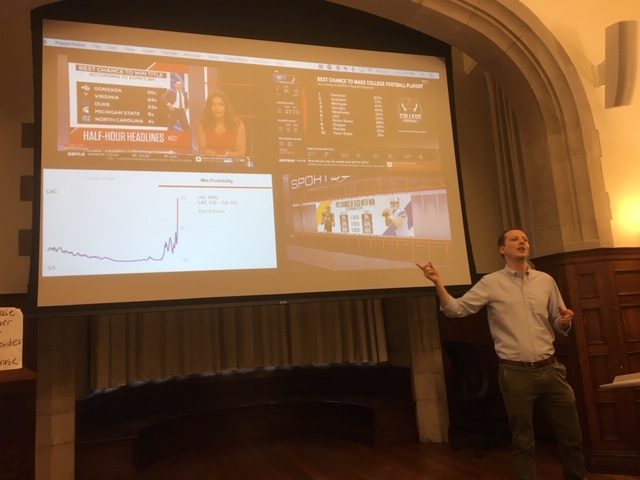
Regular ESPN viewers may already know Seth Walder ’11 from his role as a sports analytics writer. He might be explaining why the Chicago Bulls have a 59 percent chance of victory in their next game, or how many yards Tom Brady covered in his last game and what he’s expected to do in his next one.

Toward the end of the spring semester, the Office of Career Exploration and Development invited Walder back to the Bowdoin campus to talk about his career, offer some advice, and answer questions.
Describe your current job at ESPN?
We have a sports analytics team at ESPN that is within the large ESPN Stats & Information department. We're mostly a group of statisticians and developers tasked with creating new and advanced metrics about some of the sports ESPN covers. The most basic and widely seen example of this are our Power Indices, which we produce for the NFL, college football, the NBA, and college basketball. These models rate team strength, make game predictions, and produce projections. So, anytime you are watching Sportscenter and a graphic pops up saying "LSU has an 11 percent chance to win the SEC," that's coming from us.
While most of the team is made up of statisticians and developers, my job is a little bit different. My role is to turn the metrics our team creates into sports stories. That's often done through articles on ESPN.com and occasionally through on-air appearances. There's also another aspect of my job, which is to spread both our metrics and the stories they can tell internally. ESPN's such a large place that you can't expect to create a new statistic on Monday and expect it to appear on NFL Live on Tuesday. We have to talk to folks internally to show off our tools and explain how they help us tell sports stories that fans want to hear.
What impact is player-tracking technology having on sports coverage and the sports industry in general?
A tremendous impact. It's played a big role in baseball and basketball, but I'll talk about football here because it's my favorite, and it's a really exciting time in the sport for analytics. For a few years now, there have been chips in every player's shoulder pads that deliver data about their location, speed, and orientation throughout a play. A little over a year ago, teams got access to all of that information for the first time.
When most people first hear of NFL Next Gen Stats—that's what the league calls player tracking—they think of things like speed or acceleration, but it's really so much more than that. A simple example of what the data can provide is tagging: within seconds of a play, a system automatically has identified who was on the field, what formation the offense was in, which receivers received press coverage, how many high safeties there were, and more. This ends up saving a ton of time for coaches, who otherwise would have had to track all that manually.
Then there are simple statistics: the average separation, for example, between a receiver and a defensive back when the ball arrives, or how long a running back takes to reach the line of scrimmage on a rushing play.
The most exciting thing about tracking technology, however, is the advanced identification of football strategies and plays, and the information that comes out of that. What I mean by that is creating advanced models to classify, for example, different route types, different coverage types, which routes are the best against which type of coverage, and where the optimal place is to make a cut in that route. How much of a difference does it make if there's an exceptionally skilled free safety on the play? Are you less likely to have success if you keeping running that same route? The questions, and the possibilities, are endless, and the entire industry is just getting started digging into this new data. If you want to learn about the work being done on this front, check out the Big Data Bowl the NFL put on last year.
What was your career trajectory?
At Bowdoin I was coeditor in chief of the Orient and that really helped prepare me for a career in journalism. I got an internship in the sports department of the New York Daily News after graduating. My internship went well and I was fortunate that there was an opening in the department, and they offered me a job as a high school sports reporter.
It was a tough job—long subway, bus, and even ferry rides to the farthest corners of the five boroughs to cover matches—but it was an excellent learning experience. Then, in the 2012 offseason, the Jets traded for Tim Tebow, and that summer my editors asked me to go up to Cortland, NY, for three weeks. I was assigned to cover the team's training camp and to almost exclusively write about Tebow—not kidding! I stuck around covering the Jets as a backup writer that season before becoming the beat writer the following season. I did that for a few seasons and covered the Giants some in 2016 as well.
I liked the job, and it was exactly what I wanted to do a few years earlier. But I had an itch to get into the quantitative side of sports. It was a tall order: I didn't have any of the statistics or programming skills really required. But I followed what was going on in sports analytics, especially in football, and tried to write some more numbers-heavy articles when I had the chance. When I saw a job posting for a Sports Analytics Writer at ESPN, I knew I had to jump at it. I'm so happy—it really is my dream job.
Do you have any career advice for people wanting to work in this area?
It took an extreme stroke of fortune for me to land a sports analytics job without the normal requisite technical skills. The better approach is to actually learn that yourself. The advice is simple: Take some statistics courses and learn either R or Python.