Seniors in an education class have been learning valuable computer science skills to gain greater insight into the impact that policy decisions have had on some of the country’s biggest school districts.
The eight students, seven of them majors, learned how to use ArcGIS Online mapping software as they studied public education policy in a number of major metropolitan districts across the US, including Houston, Detroit and Philadelphia. The projects were undertaken as part of EDUC3333: Contemporary Research in Education Studies, a Fall 2017 class taught by Visiting Assistant Education Professor Sarah Jessen, who has now left Bowdoin College.
‘The aim,” she said, “is to look at the geography and the demographics of different districts, and how they play into school choice policies. Each student has done their own background research, examining education policy and working with various data sets to analyze the relationship between school policy and social factors. They crunched through a lot of spreadsheets and came up with some really interesting conclusions.”
Helping the students get up to speed on their mapping software skills was academic technology consultant Jennifer Snow.
“I introduced the class to American FactFinder, the Census Bureau’s tool for locating census data, and the cloud-based mapping platform ArcGIS Online, so they can plot their data on maps.
“Downloading census data is always messy, and requires considerable clean-up, so with help from my colleague Aaron Gilbreath, we cleaned up the data for each city the students were studying and culled only the variables they needed. In this way,” said Snow, “the students collected data about commuting distance, educational attainment, economic and family status, and race.”
They combined this data with the information about schools and school policy in their various cities and created their own maps. “They began to see patterns emerge about the locations of the schools, the neighborhoods, and their demographic make-up,” said Snow.

A couple of the students shared their insights:
Raleigh, NC—Lauren O’Shea ’18
O’Shea looked at the Wake County public school system in North Carolina. The biggest district in the state and the fifteenth biggest in the country, it includes the city of Raleigh and covers about 160,000 students.
“While socio economic status is obviously important, my research focused primarily on race. This is a district where less than half the students are white. About 24 percent of them are African-American and 17 percent are Hispanic.”
The district, she explained, had a performance-based, racially integrated policy until 2009, when the school board election left a Republican majority in control of school policy. “This policy was replaced with a residentially determined approach, where the school you attended was determined more by where you live. They also offered other options, including more charter schools.”
It’s too early to say definitively, said O’Shea, but indications from the 2015 census data suggest some re-segregation is occurring in the wake of this policy shift, with a higher concentration of minority students in nonwhite residential areas, and white students in white neighborhoods.
“ArcGIS enabled our class to see the power of the data we uncovered in class.”
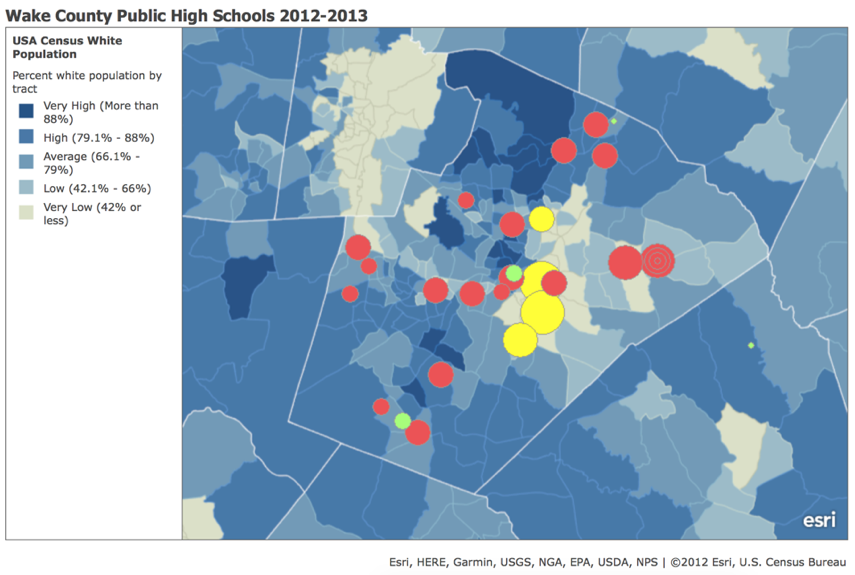 Map compiled by Lauren O’Shea ’18. The circles represent different types of public schools. Red circles are traditional schools, yellow represents magnet schools and green circles are charter schools. Size of the circle signifies percentage of non-white students (larger circle means higher minority population.)

Houston, TX—Diego Infante ’18
“I found the process both challenging and eye-opening,” said Infante, himself a graduate of the Houston public school system.
“Growing up in a ‘hood with a high concentration of low-income brown and black families, I witnessed the city’s imbalance of wealth-distribution and power. However, to see that reality on a map provoked me to question why that reality exists and came about in the first place.”
Infante noted how the expansion of charter schools in the more socio economically deprived neighborhoods—which were also ones with high Hispanic populations—has led to a situation where charter schools are often the only option. “Is this really a choice if there’s no other option? I’m also concerned by the fact that charter schools often place the needs of English language learners secondary to their goal of preparing students for college—not good news for many in those recently immigrated Hispanic families.“
The bottom line, said Infante, is that “desegregation works and nothing else does. No matter how much money or curriculum initiatives you throw at ‘the problem,’ schools remain segregated while white, affluent students and low-income students of color continue to live in vastly distinct and separate realities.”
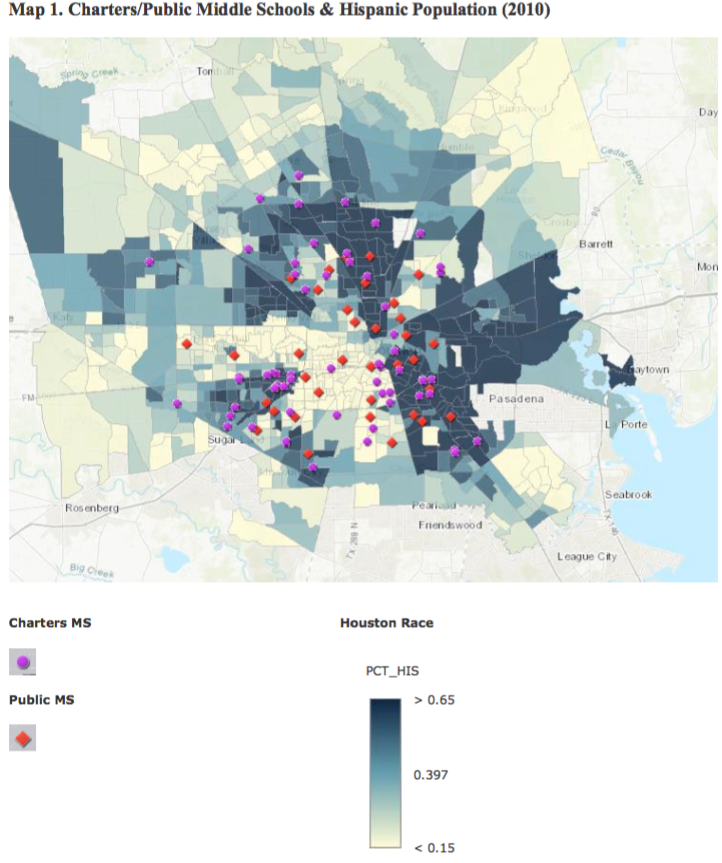
Map compiled by Diego Infante ’18 showing how charter schools have moved into Hispanic neighborhoods in Houston