Erdos-Renyi Random Graph Models (NetLogo 6)
Download Link: http://bit.ly/Erdos-Renyi.
(Right-click and save it in your computer. Make sure that the file has the .nlogo extension.)
What Is It?
You can generate and analyze networks using two variants of the classic Erdos-Renyi random graph model. Model 1 is the Erdos-Renyi model where you input the number of nodes and
the probability of forming an edge between each pair of nodes (independent of
the other pairs of nodes), and Model 2 is a variant where you input the number
of nodes and the number of edges and the model forms that number of edges
uniformly at random.
Requires the updated NW extension as of NetLogo
version 5.1.0 or later (latest testing done on NetLogo 6.3).
How It Works
The models start with a fixed number of nodes (determined by the input NUM-NODES).
Then edges are added randomly, but just how depends on the model you choose.
How to Use It
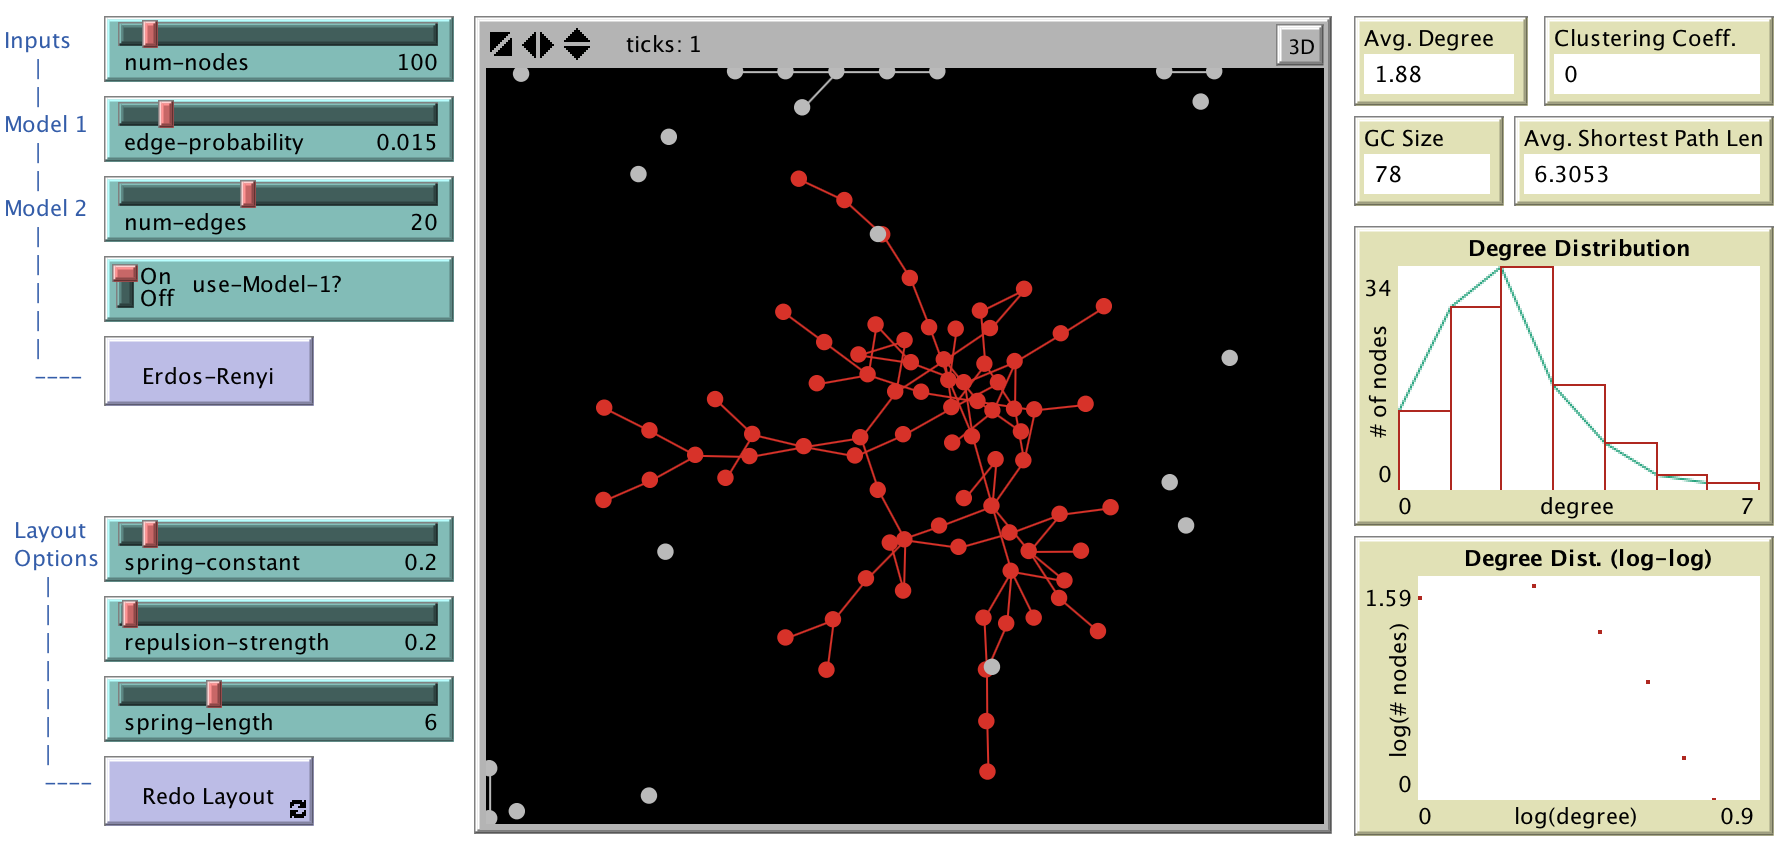
The user interface is divided into three vertical strips: left side for giving
the inputs, the middle one for visualization, and the right side for displaying
relevant analytics.
Inputs
NUM-NODES: Use this slider to input the number of nodes.
EDGE-PROBABILITY: For Model 1, select the probability of
forming an edge between each pair of nodes, independent of the other pairs of
nodes. This is used in Model 1.
NUM-EDGES: For Model 2, select the number of edges you want.
These edges are chosen uniformly at random from among all possible pairs of
nodes. That is, NUM-EDGES are formed randomly from NUM-NODES * (NUM-NODES - 1)
/ 2 number of possible candidates of edges.
ON-OFF SWITCH: ON selects Model 1, OFF Model 2.
ERDOS-RENYI: Constructs a random graph according to the
selected model.
REDO LAYOUT: Uses a spring layout algorithm to reposition
the nodes (you will typically want to keep this off while applying the network
construction algorithms). You may adjust SPRING-CONSTANT, REPULSION-STRENGTH,
and SPRING-LENGTH to generate your desired layout.
Analytics
AVG. DEGREE: Shows the average degree of the network.
CLUSTERING COEFF.: Shows the global clustering coefficient,
computed as the average of each nodes local clustering coefficient.
GC SIZE: Shows the size of the largest component, which is
colored red in the visualization.
AVG. SHORTEST PATH LEN: Shows the average shortest path
length among all pairs of nodes across all the connected components of the
graph. That is, for each connected component and for each pair of nodes within
that component, the shortest path length is computed. Finally, the average
shortest path length is computed as the total length of all the shortest paths,
divided by the number of pairs of nodes considered.
DEGREE DISTRIBUTION: Shows two plots of degree distribution,
the latter is in log-log scale.
Points to Ponder
The degree distribution has the shape of Poisson distribution. In log-log
scale, it is not a straight line. Do you see the difference with Power-law
degree distribution?
How many closed triads do you see? Does the clustering
coefficient support your observation? Why is the clustering coefficient low in
general for Erdos-Renyi random graphs?
Does the size of the giant component vary smoothly with the
model parameters (e.g., EDGE-PROBABILITY)? Can you simulate the sudden
emergence of a giant component? Also, why don't you see multiple giant
components?
Why is the average shortest path length small in general for
Erdos-Renyi random graphs?
Copyright and
License
This model is adapted by Mohammad T. Irfan (Bowdoin
College) from a previous version by Lada Adamic, which in turn was adapted from Uri Wilensky's Giant Component model in NetLogo's
models library.
Updates by Mohammad:
1. Added clustering coefficient and average shortest path computation.
2. Made the two Erdos-Renyi models conform to textbook
presentations of Matthew Jackson's "Social and Economic Networks" and
M.E.J. Newman's "Networks." In particular, got rid of the
NUM-NEIGHBORS parameter and included NUM-EDGES for use in Model 2.
3. Improved the user interface, which now consists of three distinct vertical
areas. Separated the model parameters from the layout controls. Also, separated
the analytics from all the inputs.
4. Revised the POINTS TO PONDER section.
5. Fixed a couple of bugs in the previous version that kick in when the network
is empty (i.e., no edges).
Copyright Mohammad T. Irfan.
![]()
This work is licensed under the Creative Commons
Attribution-NonCommercial-ShareAlike
3.0 License. To view a copy of this license, visit http://creativecommons.org/licenses/by-nc-sa/3.0/
or send a letter to Creative Commons, 559 Nathan Abbott Way, Stanford,
California 94305, USA.