Project 6: Computing sea-level rise (SLR) flooding using grid DEMs
SLR test grids
Overview
You have undoubtly heard that one of the consequences of climate
change is melting of the polar ice-caps, which will cause the sea
level to rise globally, bringing the risk of flooding to all coastal
areas.
Scientists predict between 3 to 5 feet of sea-level rise in the
next century
[IPCC
2007 report].
This is a concern as many major cities lie in low areas in close proximity to the
coast, and flooding will cause significant damage and disruptions to
these cities and to the millions of people who live in them.
States and institutions have started to model the extent and impact
of the flooding. The first step in this process is to use digital
elevation models to compute what parts of the coast will get underwater
in different flooding scenarios.
When run on high-resolution digital elevation models derived form
LiDAR point clouds, the accuracy of these models at predicting the
extent of sea level rise flooding is high.
SLR viewers: examples
Most widely used are the SLR viewers developed by National Oceanic
and Atmospheric Administration (NOAA), which can be accessed from
their Digital coast
website:
- Sea-level rise visualization
for Alabama, Mississippi and Florida, a collaborative effort by
NOAA, USGS, 2010.
Note how you can select the SLR scenario (1ft, 2ft, 3ft,...). The
flooding is not done in real time; it is pre-computed at these
magnitudes, and it is visualized.
I could not find a link to documentation, but there's a chance that
they use 1m or 2m resolution LiDAR data (or perhaps 10m data, which is
freely available for the entire US).
This earlier project (2010) only shows flooding for the coast of
MI, AL and FL.
-
NOAA sea-level rise
viewer [NOAA, 2011].
Again, you can select one of six flooding scenarios (1ft, 2ft, 3ft,
4ft, 5ft, 6ft). The flooding for each scenario is pre-computed, and is
visualized overlayed on the map when the user selects it.
Documentation for this project can be found here.
A paper that details
it: New
mapping tool and techniques for vizualizing sea level rise and coastal
flooding impacts [NOAA, 2011].
I remember reading that this model is based on 10m-resolution data
[would be nice to find a reference]. Grid DEMs at 10m resolution are
freely available for the entire US from USGS website, based on data
collected by NASA SRTM in 2001.
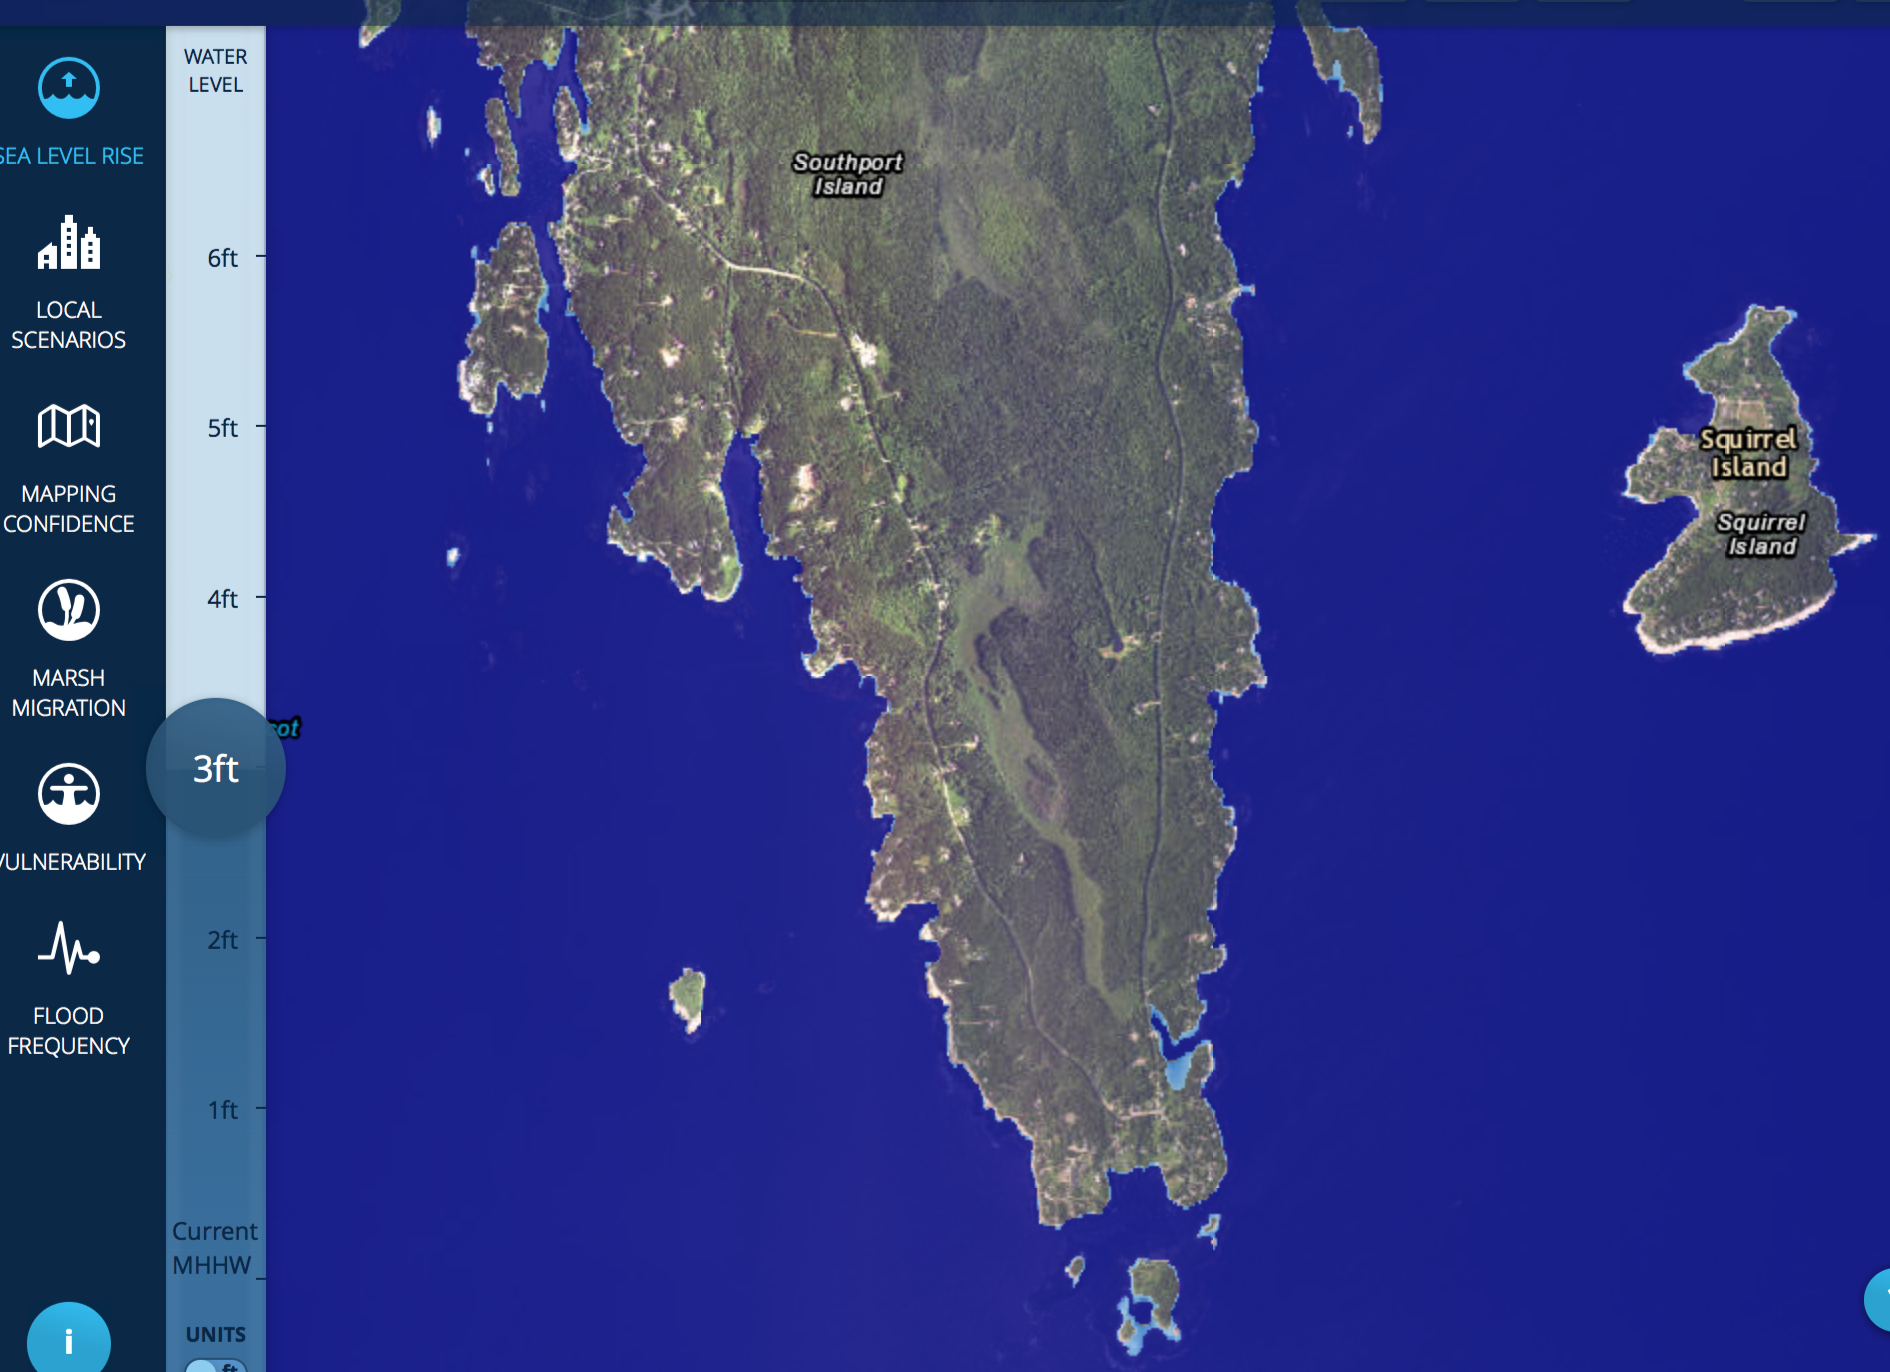
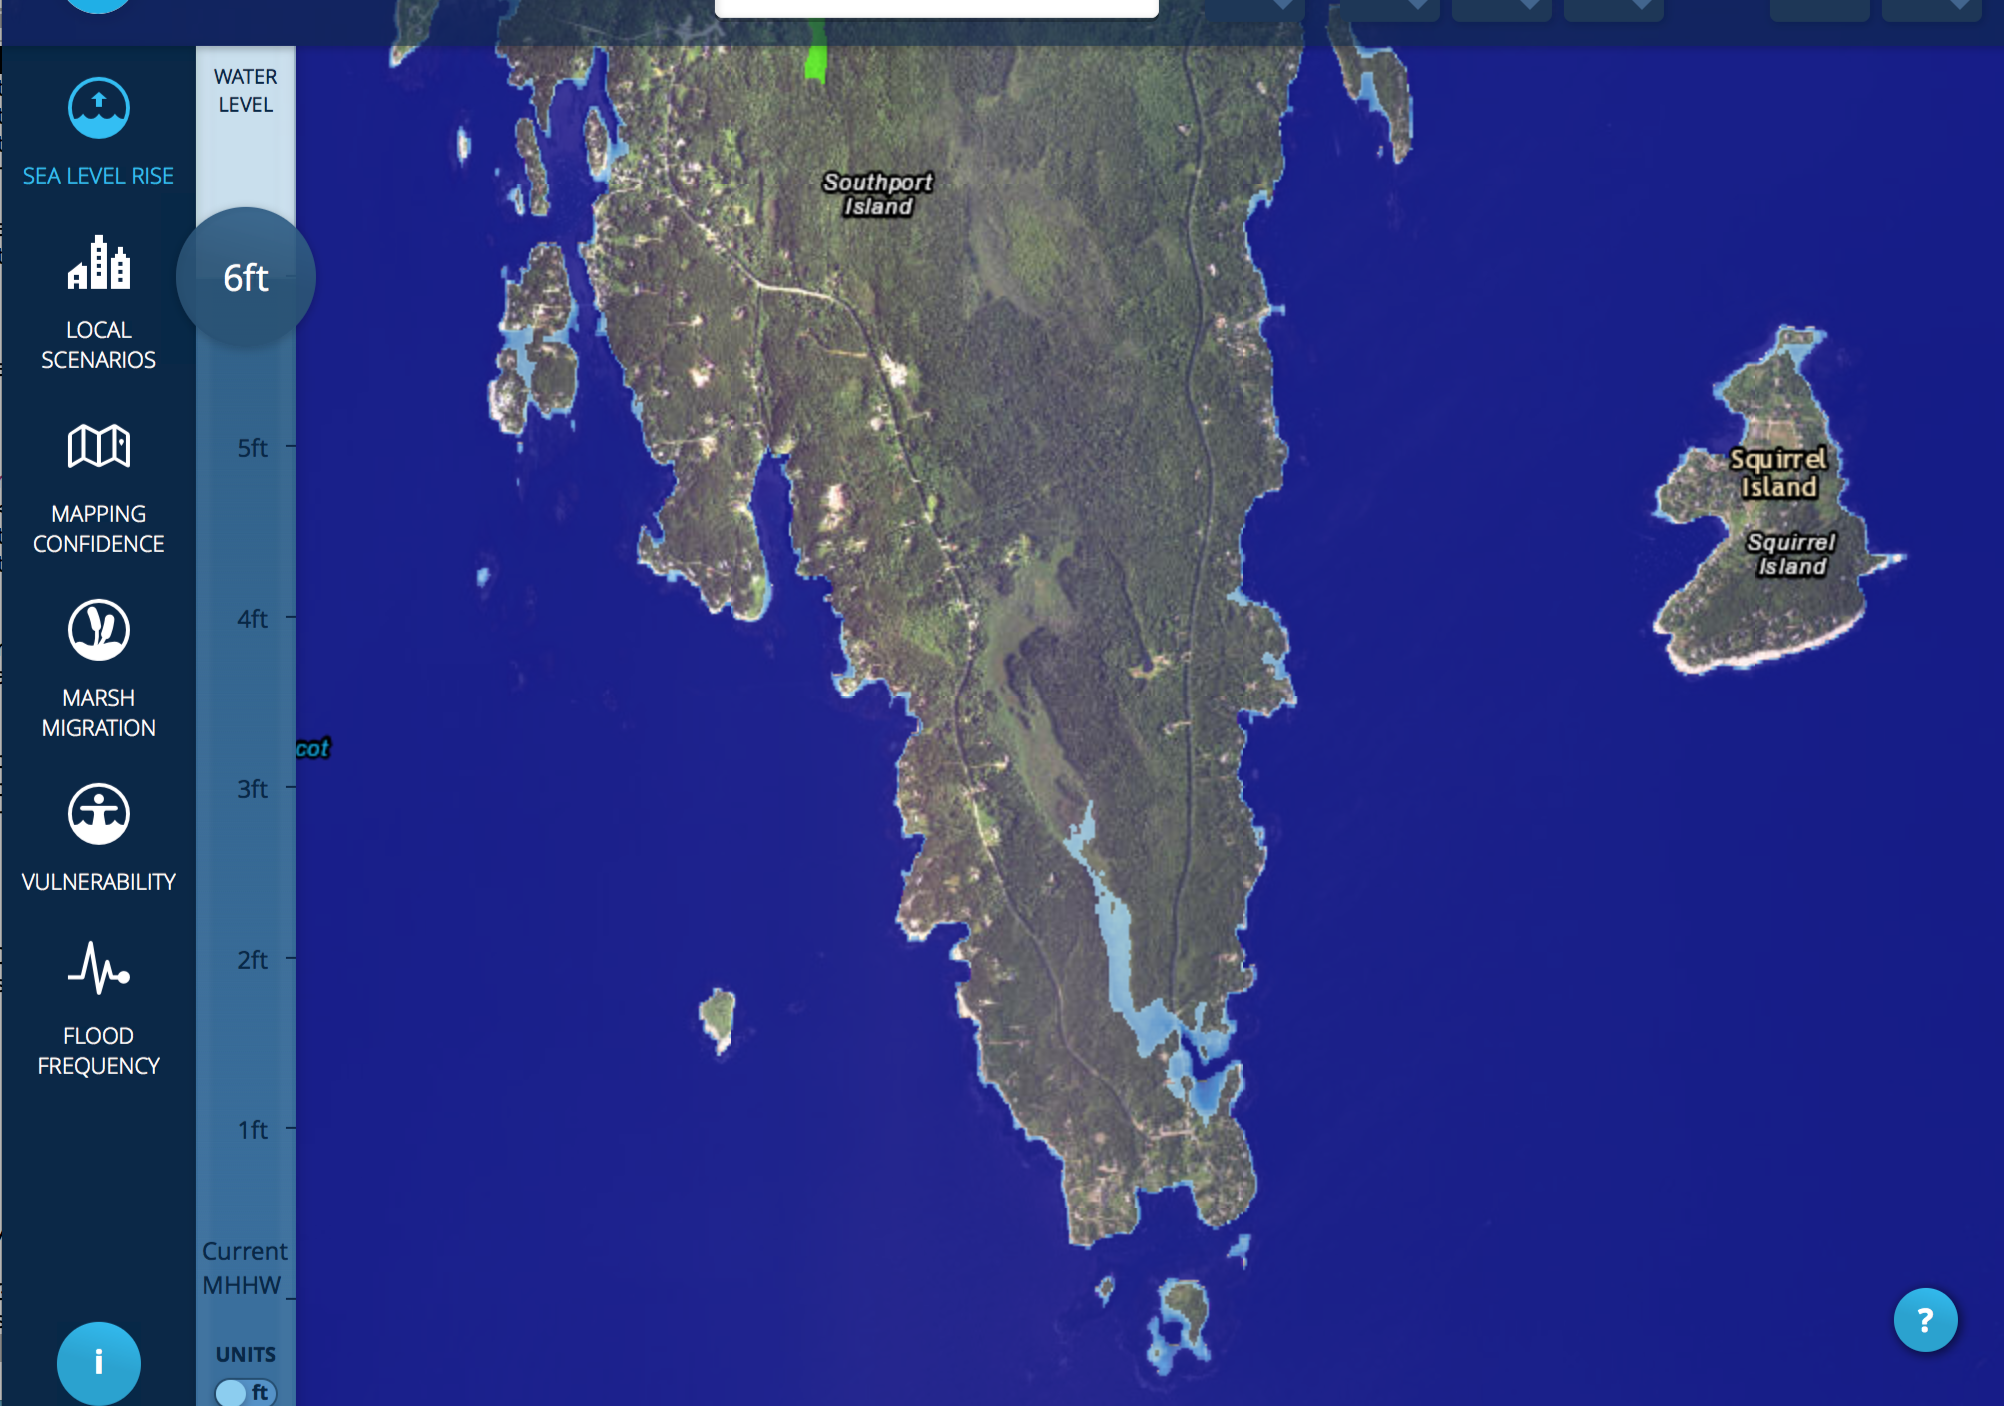
Below are screenshots of flooding Southport Island (Maine) with 3ft
SLR, and 6ft SLR. I picked this island because we have a 2m DEM for
it [thanks to Eileen Johnson, ES], so you'll be able to use it to test
your flooding against the images below.
- Computing SLR flooding based on high-resolution DEMs (1m or 2m)
derived form LiDAR data.
SLR flood modeling using 10m resolution DEMs based on SRTM data is
not ideal because of accuracy issues (both horizontal and vertical).
LiDAR data has high accuracy, which makes it the top choice for
modeling. However LiDAR data coverage is not complete. It is certainly
not widely available, though some states, and especially the
flood-prone states, have started to collect it.
Modeling flooding with LiDAR data brings the challenge of
performance because of its huge size: a 2m-resolution DEM for a small
part of the coast may consist of several billion points. Building such
a huge DEM from lidar point cloud is an issue, and often exceeds the
capabilities of software. Building 1m- or 2m-DEMs for an entire state
requires may require hundreds of billions of points.
Sea-level rise viewers based on 2m-resolution LiDAR data, therefore
improving on the NOAA SLR viewers above, are becoming available, on
state-by-state basis.
SLR flooding: how it works
The basic problem is the following: Given a grid terrain (part of
which is the sea) and a sea-level rise (e.g. 3ft), compute flooding of
the terrain as the sea rises to the given level. The ouput of this
process is a grid, of the same size as the input elevation grid, where
each point is marked as either flooded, or not.
How does this work? One way to think about this is to intersect
the terrain with a horizontal plane at z=sea-level: that is, find all
points with elev <= slr. This will create a bunch of
"blobs": compute their connected components, and retain only the
connected component of the sea. This is the approach taken by NOAA SLR
viewer
(Detailed
method for mapping sea level rise innundation, NOAA, 2017).
In this project you will develop a different and arguably simpler
approach, based on the following idea. As the sea level is rising,
points on the coast that are low (i.e. their elevation is below
sea-level) will get underwater, and through them, the water may go
further inland. In other words, points that
- are reached by water; and
- have elevation below the water
are flooded. They become water. Repeat.
One question that you'll run into is: how is the water labeled in
the elevation grid? In an ideal world the sea points would have
their own label, so that we can easily say if a point is in the sea or
not. In practice water gets labeled as NODATA. The caveat is that not
all NODATA points are water, so we'll have to make some assumptions:
- we'll assume that all water (sea, as well as lakes and streams) is labeled
as NODATA
- we'll assume that the sea touches the boundary of the grid
- we'll assume that all NODATA points connected to the boundary of the grid are the sea
- the elevations in the grid have been processed so that they represent
elevations above the water-level, which is assumed to be at zero.
The interface
At a bare minimum, your code should take the name of an elevation
grid, a rise, and the name of a flooded grid where to write the
flooded terrain.
./slrflood elev.asc 3 flooded.asc
We shoud be able to render the resulting grid:
render2d flooded.asc
The rest is open-ended. Here are some possibilities.
- Refine the output grid: instead of binary (flooded/not flooded),
record the depth of the flooding.
- Incorporate rendering the grid in your code (probably want to
use 2D; check the code of render2d for how to set up openGL
projection).
- Vizualize the flooded parts "on top" of the terrain (if a point
is flooded, render it in FLOODEDCOLOR, else render with a color
based on its elevation).
- Simulate the advancing/retracting waters: press + to increase
the SLR by say 1ft, press - to decrease it by same amount. Recompute
the flooded parts and rerender.
- Print info/stats on how many points are flooded.
- Consider the memory and time efficiency of your
algorithm, in theory; and in practice its performance on large data. The DEM folder on
dover:/mnt/research/gis/DATA/DEM contains a grid for
Maine::Lincoln county at 2m resolution, about 900 million points;
also a grid for Maine::Knox county at 2m resolution, of similar
size. Both grids have been generated from LiDAR data by
interpolating and gridding the points classified as "ground". The
process is similar to what you developed for project 5, except that
it needs to work on hundreds of millions of points at once (This was
done in ArcGIS, which was left to run overnight).
Can your code flood a grid of 900 million points? How long?
- Consider the cache-efficiency of your algorithm.
- Take advantage of the multi-cores. The problem of flooding
is not immediately parellizable (like the viewshed problem) however
some simple data partition strategies can be explored and its an
opportunity to dwelve more into parallelization.
Test data
Any of the grids that border the sea can be used for testing. You'll
find some small ones here (Southport
provided by Prof. Eileen Johnson, ES).
The larger sets are not available online; you can find them at:
dover::/mnt/research/gis/DATA/SLR/.
Would be great to also flood Boothbay Harbor: I only have .las data
for it, but we could use your lidar project to classify the ground
and grid it (you'll need to add the save capability, but you have a
writetofile() function from a previous project). Or, you could use
LASTools::las2dem [this may not be open source, but binaries are
available].
The paper
Write a paper/report that summarizes the work that you did for
this project. Do not worry about writing a certain number of pages,
but rather that you include sufficient information so that someone
who reads the paper can understand all the work that you've done for
this project, the high level algorithm, the details of the
implementation, and an overview of how you tested it and how it
works in practice.
You will use LaTex. If this is the first time you use LaTex, check
the www for more info.
Feel free to use the Latex templates here
(at http://www.bowdoin.edu/~ltoma/teaching/LatexTemplate/ );
they were created for previous classes, so disregard the details.
To install Latex on your computer, you could try MacTex:
http://tug.org/mactex/
There are many LaTex guides online, if you should need anything beyond
the template. Here is a suggested outline for the paper:
- Don't forget to include your name(s) and github repo for this project
- [Section 1] Introduction and background: A short description of
the problem you solve, how it is defined, why it is important and how
it is used. General level and relatively brief, at least for this
report.
- [Section 2] The algorithm: Here you describe, at a general level,
the approach.
- [Section 3] Implementation: Describe any details that are
relevant to understanding how your code works, and to understand its efficiency.
- Section 4: Experiments. Describe how you tested your
code in practice, on what datasets, and comment on the output and
the running time. Include screenshots. Include running times.
- Section 4: Conclusion/discussion. Describe what you learnt in
this project, what went well/not so well, any related stories that you
want to share, any questions you ran into, any insights. Feel free to
share thoughts on what you liked.did not like in this class and what I
shodl keep/not keep next time I teach.
What to turn in
Push the code and the paper, also bring a hard copy of the paper to class.
Grading
Total 25 points
Enjoy!